
The bar graph
illustrate
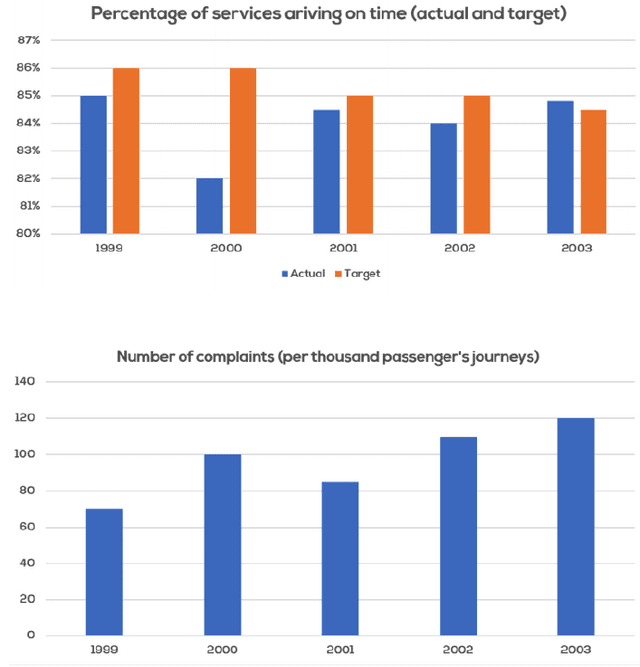
the performance of a bus company with regards to their punctuality, both actual and goal, and the number of complaints and passengers.
Change the verb form
illustrates
Overall
, what stands out from the data is that the company lowered their standard percentage throughout the given Linking Words
period
, Use synonyms
whereas
the complaints within the given Linking Words
period
Use synonyms
increases
.
On the one hand, it is noticeable that the company's target percentage slowly Replace the word
increased
decreases
from 86% in 1999 and became under 85% in 2003, Wrong verb form
decreased
moreover
the actual figure Linking Words
off
services arriving on time Change preposition
for
experience
a fluctuation. In 1999 the portion was 85%Wrong verb form
experienced
,
before a gradual dropped by at least 82% in 2000. Remove the comma
apply
However
, Linking Words
on
the following year it significantly Change preposition
in
increases
, but hovered at the same level until the end Wrong verb form
increased
period
in 2003 at just under 85%
Use synonyms
On the other hand
, the number of complaints (per thousand passenger's journeys) continued to increase within the Linking Words
4 year
Add a hyphen
4-year
period
. In 1999, it was only around under 80 people, before reaching its highest point by 2003 at 120, respectively.Use synonyms