The charts below show the changes in ownership of electrical appliances and amount of time spent doing housework in households in one country between 1920 and 2019. Summarise the information by selecting and reporting the main features, and make comparisons where relevant. Write at least 150 words. Percentage of households with electrical appliances (1920-2019) 0 Percentage of households 100 90 80 70 60 50 40 10 0 1920 1940 - Washing machine 1960 1980 2000 2019 Year o Refrigerator ~ O- Vacuum cleaner Number of hours of housework* per week, per household (1920-2019) Number of hours per week 888888 0 1920 1940 1960 1980 2000 2019 Year -0- Hours per w

The charts below show the changes in ownership of electrical appliances and amount of time spent doing housework in households in one country between 1920 and 2019.

Summarise the information by selecting and reporting the main features, and make comparisons where relevant.

Write at least 150 words.

Percentage of households with electrical appliances

(1920-2019)

0

Percentage of households

100

90

80

70

60

50

40

10

0

1920

1940

- Washing machine

1960

1980

2000

2019

Year

o Refrigerator

~ O- Vacuum cleaner

Number of hours of housework* per week, per household (1920-2019)

Number of hours per week

888888

0

1920

1940

1960

1980

2000

2019

Year

-0- Hours per w
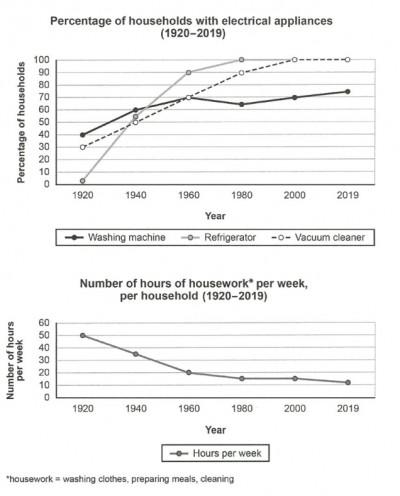
The line graph illustrates the changes in electrical appliances namely washing machines, refrigerators, and vacuum cleaners in the percentage of households per week between 1920 and 2019 in one country.
It is clear that
refrigerators increased rapidly by approximately 90 per
cent
between 1920 to 1960. After 20 years it was slightly increased.
Then
, it levelled off from 1980 to 2019.
Moreover
, the changes in washing machines fluctuation for around 100 years. Roughly, the percentage of vacuum cleaners was raised gradually at the stage of 1920 to 2000. After, it remained constant at 100 per
cent
.
However
, the electrical appliances gradually decreased for hours of housework per week from 1920 to 1960.
Furthermore
, between 1980 and 2019
this
line slightly reduced by 10 per
cent
.
Overall
, 40 per
cent
of hours were reduced in around 100 years.
Submitted by krishmahendran19 on

Unauthorized use and/or duplication of this material without express and written permission from this site’s author and/or owner is strictly prohibited. Excerpts and links may be used, provided that full and clear credit is given to Writing9 with appropriate and specific direction to the original content.

Common mistake: Your writing should be 150-250 words.
Vocabulary: Replace the words cent with synonyms.
Vocabulary: Rephrase the word "changes" in your introduction.
Vocabulary: The word "changes" was used 2 times.
Vocabulary: The word "percentage" was used 2 times.
Vocabulary: The word "increased" was used 2 times.
Vocabulary: The word "reduced" was used 2 times.
Vocabulary: The word "around" was used 2 times.
Vocabulary: The word "gradually" was used 2 times.
Vocabulary: The word "slightly" was used 2 times.
What to do next:
Look at other essays: