
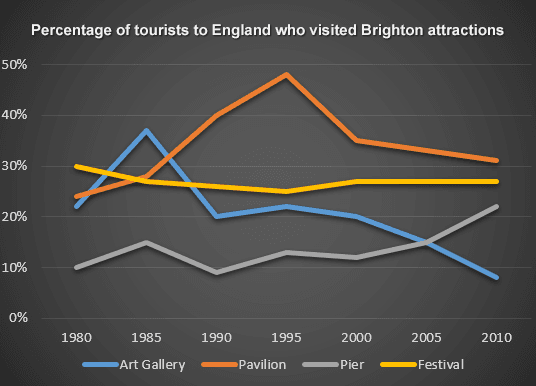
The line graph compares, the percentage of tourists to England who visited the
Art
Use synonyms
Gallery
, Use synonyms
Pavilion
, Use synonyms
Pier
and Festival in Brighton from the Use synonyms
year
1980 to 2010.
To summarize, in the given period, the proportion of tourists who visited the Use synonyms
Pavilion
stood first followed by the Festival, Use synonyms
Pier
and the Use synonyms
Art
Use synonyms
Gallery
.
In the Use synonyms
year
1980, the number of people who came to visit the Festival was 30% Use synonyms
while
24% and 20% paid a visit to the Linking Words
Pavilion
and the Use synonyms
Art
Use synonyms
Gallery
. Use synonyms
Therefore
, the proportion of Linking Words
Pier
was 10%. Till the Use synonyms
year
1985, the population increased slowly in all four tourist places, Use synonyms
whereas
in Linking Words
Pavilion
, it was rapidly processed to 48% and Use synonyms
also
in Festival it ranges constantly till the Linking Words
year
2010. Use synonyms
Further
, the Linking Words
Art
Use synonyms
Gallery
and Use synonyms
Pier
declined in the next few years and later raised with the same ratio since 2005. Use synonyms
On the contrary
, in the Linking Words
year
2010, the percentage reduced in the Use synonyms
Art
Use synonyms
Gallery
and Use synonyms
Pavilion
by 9% and 31% respectively, but the Use synonyms
Pier
increased to 22%.Use synonyms