
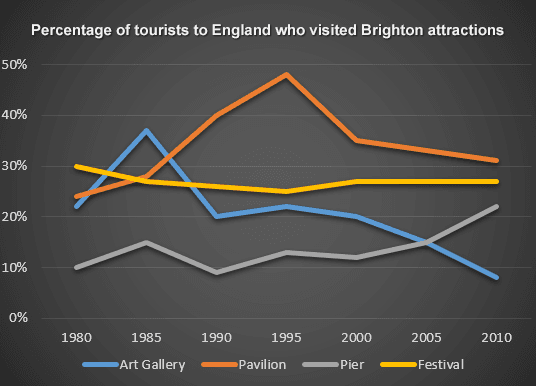
The line graph illustrates the proportion of purposes that several travellers want to go to Brighton, England for 30 years after 1980.
Overall
, it can be seen that there was a downward trend with the exception of the pier and festival.
The art gallery and pavilion experienced the same trend, these Linking Words
initially
started with 22% and 23%.
Linking Words
Although
these rose significantly in half of the given period, there was a dramatic decline in both categories. Especially, art Linking Words
gallery
saw a significant decrease since 1995Fix the agreement mistake
galleries
,
and dropped to just over 8% in 2010.
Turning to the remaining categories, the festival slightly dropped since the beginning of the period and remained almost the same percentage until 2010 at about 28%. Meanwhile, there was a steady fluctuation in the pier until 2000; Remove the comma
apply
then
, Linking Words
this
had a rapid growth until 2010 to just over 20%.Linking Words