
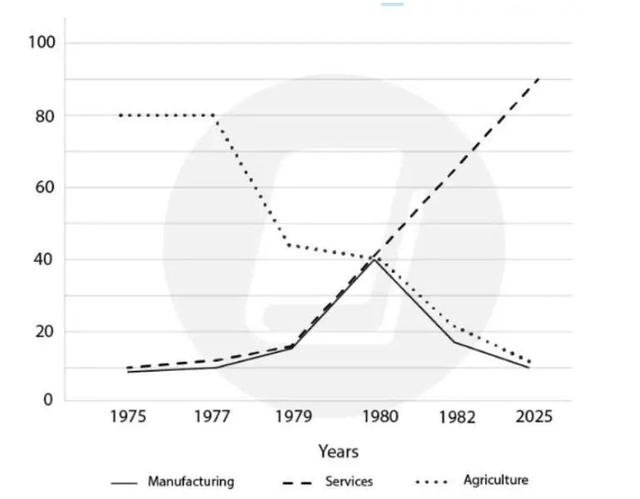
This
line chart depicts The most famous employment in the USA and predictions for the next years. It is clear from the graph that, the farmsing will be less than others.
Linking Words
According to
what is shown, the manufacturing and services were by around 10 per cent in 1975 and increased gradually after four years. Linking Words
However
, in 1979 the increase was climbed until 2025.
Linking Words
On the other hand
, agriculture was 80% at the same level from 1975 to 1977, after ,that it clearly dropped to 42 per cent in 1997, Linking Words
then
the decrease will be until 2025.
Linking Words
To sum up
, we could say that manufacturing and services will be a trend in the USA in the future.Linking Words