
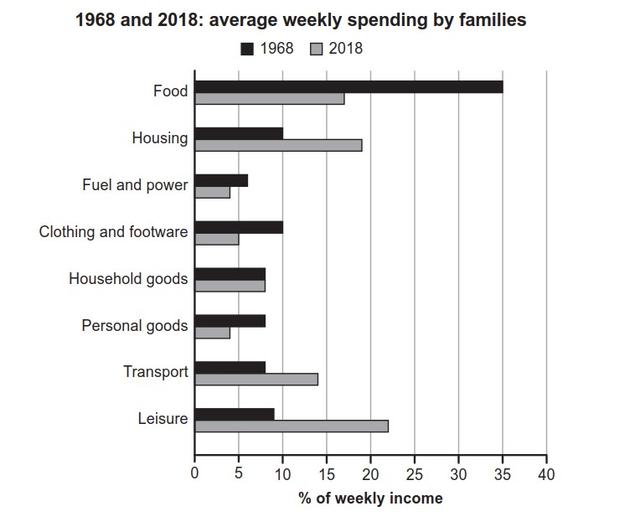
The provided chart depicts the average weekly spending salaries by families in one country in 2 different years.
It is clearly observed from the chart that in 1968, people spent most of their wages on food and the least amount of money was on fuel and power. In 2018, the public was willing to spend on leisure more and personal
goods
, fuel and power were less substantial for them.
In 1968, the population allocated 35% of their weekly income to food and Use synonyms
this
Linking Words
figure
dramatically decreased to 30% for housing and another category which was called clothing and footwear. Use synonyms
In addition
, the proportion of leisure stood at nearly 10 %. Linking Words
Whereas
, the Linking Words
figure
for transport, personal Use synonyms
goods
and household Use synonyms
goods
were equal to each other by approximately 8%. Use synonyms
Moreover
, the lowest percentage of their weekly wage was spent on fuel and power nearly 6%.
In 2018, leisure was more popular spending about 22%. Linking Words
Besides
, the Linking Words
figure
for spending on housing was 18% Use synonyms
while
that for food was 17%. Linking Words
Furthermore
, the proportion of expenses on transport stood at 14% and the Linking Words
figure
for household Use synonyms
goods
was lower at 7%. Use synonyms
In addition
, the clothing and footwear expenditures were 5% in a week for a family and the amount of spending money on personal Linking Words
goods
was as much as that of clothing and footwear about 4%.Use synonyms