
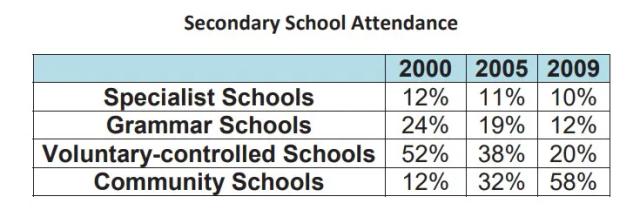
The data provided in the form of a table illustrates how many students were enrolled in four secondary school types from 2000 to 2009.
Overall
, at the beginning of the surveyed Linking Words
period
the Voluntary-controlled Add a comma
,period
Schools
were the most popular Use synonyms
schools
, Use synonyms
Linking Words
however
Community Add a comma
,however
Schools
were liked by more students in 2009.
Use synonyms
Also
, there was a downward trend in the number of pupils attending all types of Linking Words
schools
, except Community Use synonyms
Schools
, in which the tendency of people to study there increased significantly.
From 2000 to 2009, Grammar Use synonyms
Schools
and Voluntary-controlled Use synonyms
Schools
experienced a substantial decrease in enrollment of children and reached
nearly half of its number in 9 years
at 12% and 20%, respectively.Use synonyms