
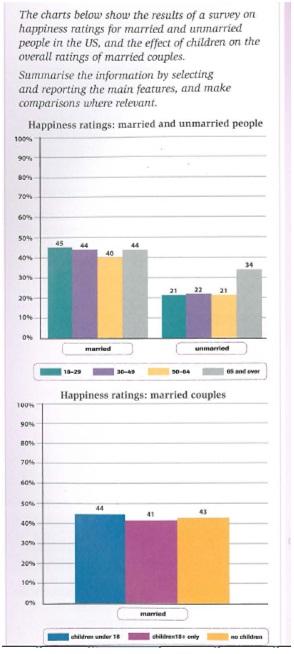
These two charts present two kinds of data: the first is about the
happiness
level between married and unmarried Use synonyms
people
and the second gives information about the satisfaction rating because of Use synonyms
children
among married couples. Use synonyms
Overall
, unmarried Linking Words
people
are not as happy as married ones Use synonyms
while
in the unmarried Linking Words
people
category, Use synonyms
the
certain Correct article usage
a
age
group is happier than others. Use synonyms
However
, the second chart shows that the percentage of Linking Words
happiness
Use synonyms
that is
affected by whether having Linking Words
children
or not is just shared in similar numbers.
Use synonyms
To begin
with, individuals who are married from all Linking Words
age
groups witness the biggest proportion of Use synonyms
happiness
in numbers around 40%-45% compared to unmarried Use synonyms
people
. Meanwhile, Use synonyms
people
with Use synonyms
age
65 and over who prefer to not marry, experience more satisfaction at 34% Use synonyms
whereas
the other Linking Words
age
groups only reach the figures roughly 21%-22%. Use synonyms
Furthermore
, the percentage of Linking Words
happiness
in another chart between married Use synonyms
people
who have Use synonyms
children
under 18, Use synonyms
children
older than 18 and those who have no Use synonyms
children
almost alike at 44%, 41% and 43% respectively.Use synonyms