Two charts: a line graph shows the number of people granted UK citizenship (in thousands) from 1992 to 2002 and a bar graph illustrates the number of people (in thousands) from Asia, Africa, America, Europe, Australia, and others, receiving UK citizenship in 1996 and 2002. Summarise the information by selecting and reporting the main features and make comparisons where relevant.

Two charts: a line graph shows the number of people granted UK citizenship (in thousands) 

from 1992 to 2002 and a bar graph illustrates the number of people (in thousands) from Asia, Africa, America, Europe, Australia, and others, receiving UK citizenship in 1996 and 2002. 

Summarise the information by selecting and reporting the main features and make 

 comparisons where relevant.
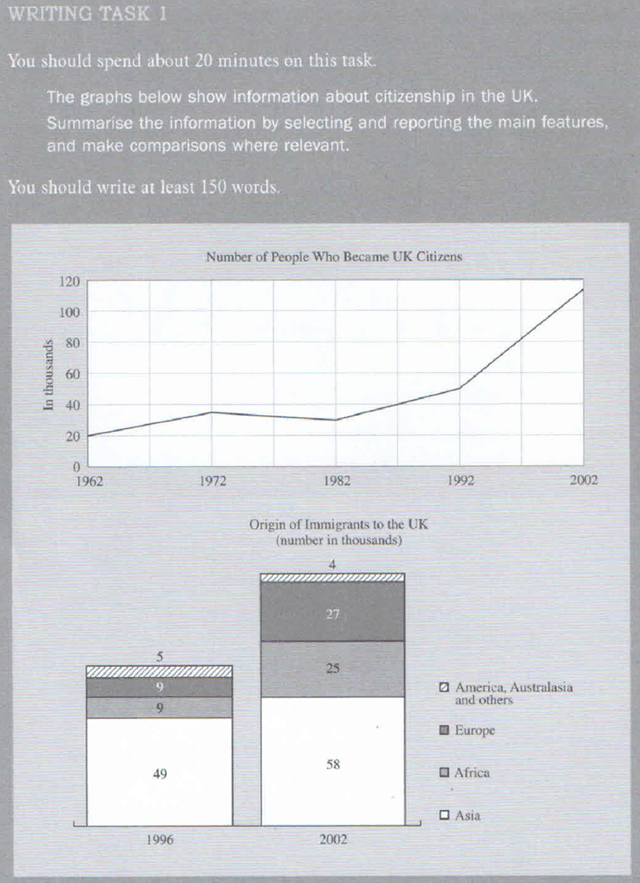
The given graphs demonstrate the figures for immigrants who became
UK
citizens from 1962 to 2002 and
also
provide information about their origin in 1996 and 2002.
Overall
, a steady rise can be seen in the number of citizens through these 40 years.
Moreover
, Asians were the major proportion of immigrants in both 1996 and 2002
while
African and European people who immigrated to the
UK
in 2002 were considerably more than in 1996.
According to
the line graph, 20,000 people around the world were granted
UK
citizenship in 1962. The figure for these people increased to about 37,000 and
then
it experienced a 4,000 fall for the next 10 years. After 1982, a sharp increase happened to more than 110,000 in 2002. Based on the bar graph,
although
just about 5,000 Americans and others immigrated to the
UK
in the reported years, Asians moved to
this
country 10 times more.
Furthermore
, the number of European and African immigrants which were 9,000 in 1996, increased noticeably in 2002 to 25 and 27000.
Submitted by a.ansari3103 on

Unauthorized use and/or duplication of this material without express and written permission from this site’s author and/or owner is strictly prohibited. Excerpts and links may be used, provided that full and clear credit is given to Writing9 with appropriate and specific direction to the original content.

Vocabulary: Replace the words uk with synonyms.
Vocabulary: The word "graphs" was used 3 times.
Vocabulary: The word "figures" was used 2 times.
Vocabulary: The word "number of" was used 2 times.
Vocabulary: The word "increased" was used 3 times.
Vocabulary: The word "about" was used 3 times.
What to do next:
Look at other essays: