
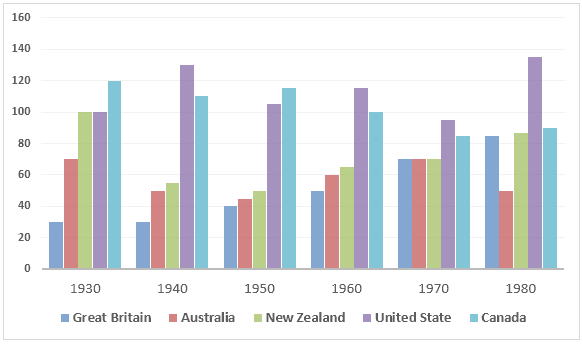
The bar chart compares the
number
of people who were arrested in five different countries over a Use synonyms
period
of 50 years from 1930 to 1980.
In general,the Use synonyms
figures
for imprisonment fluctuated over the given Use synonyms
period
,Use synonyms
although
the United States had the highest Linking Words
number
of Use synonyms
prisoners
Use synonyms
whereas
Great Britain had the lowest Linking Words
number
of Use synonyms
prisoners
.
As can be seen from the graph,the United States had the highest indicators of Use synonyms
prisoners
for the majority of a given Use synonyms
period
,and in 1980 the Use synonyms
figures
for Use synonyms
this
country peaked at nearly 140,000.Canada had the highest Linking Words
figures
in 1930 and 1950 with approximately 120,000 Use synonyms
prisoners
in both years.
The Use synonyms
figures
for New Zealand and Australia fluctuated between 40,000 and 100,000 Use synonyms
prisoners
,Use synonyms
although
imprisonment in New Zealand tended to be the higher of the two.Linking Words
In contrast
to the Linking Words
figures
for other countries,the Use synonyms
number
of Use synonyms
prisoners
in Great Britain rose steadily between 1930 and 1980 and reached about 80,000 Use synonyms
at the end
of the Linking Words
period
.Use synonyms