
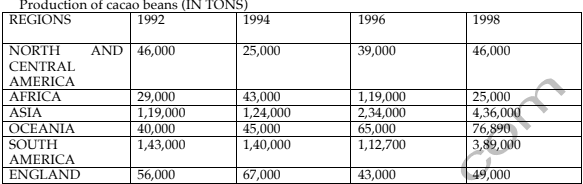
The illustration demonstrates the number of produced cacao
beans
in six regions in the period from 1992 to 1998.
Use synonyms
Overall
, the largest production level occurred in South America and Asia, Linking Words
however
, in 1998, Asia fabricated 436000 Linking Words
tons
and hit the highest point. Use synonyms
Moreover
, the lowest amount of cocoa Linking Words
beans
throughout the whole period was received in Africa in 1996(around 12000 Use synonyms
tons
).
Use synonyms
According to
the table, the fluctuation is observed in North and Central America, though, the smallest level was in 1994, in 1996 there was a noticeable rise to 39000 Linking Words
tons
. Meanwhile, the production in Asia, Oceania and South America was significantly growing year by year. In 1992 Oceania manufactured only 40000 Use synonyms
tons
of Use synonyms
beans
, Use synonyms
however
, in 1998 Linking Words
this
number almost doubled to 76980 Linking Words
tons
. Use synonyms
In addition
, the development of cacao Linking Words
beans
in England remained stable, varying around 50000 Use synonyms
tons
, where the peak was reached in 1994(just above 65000 Use synonyms
tons
).Use synonyms