
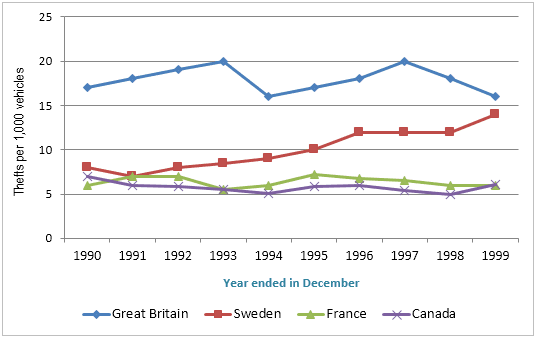
The given graph illustrates the number of robbed
cars
in four countries: Great Use synonyms
Britain
, Sweden, France, and Canada. Use synonyms
Overall
, Linking Words
it is clear that
Great Linking Words
Britain
had the highest rate of stolen vehicles among the four countries from 1990 to 1999.
Use synonyms
According to
the lines given, the most theft Linking Words
cars
were in nearly 1993 and 1997 that were at 20000 Use synonyms
cars
(both were in Great Use synonyms
Britain
). Use synonyms
However
, the least theft Linking Words
cars
were in almost 1994 and 1998 which were 5000 in Canada.
Use synonyms
On the other hand
, the lines for France, Canada, and Great Linking Words
Britain
showed some fluctuation that was the opposite of Sweden which was surging gradually. In conclusion, the robbery of Use synonyms
cars
never ends but can decline in all countries.Use synonyms