The graph below show the proportion of four different materials that were recycled from 1982 to 2010 in a particular country

The graph below show the proportion of four different materials that were recycled from 1982 to 2010 in a particular country
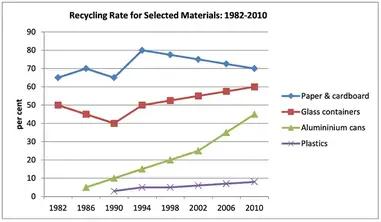
The graph provides information about
recycling
Add an article
the recycling
show examples
process of four materials (Paper and cardboard,Glass containers,Aluminium cans and Plastics) between 1982 and 2010 in a country.
Overall
, the proportion of paper and cardboard that was recycled was the highest of the four classes of material with some fluctuations, but
this
category experienced a decline after 1994.In
addittion
Correct your spelling
addition
,there was a continuing upward trend with fluctuations in the recycling of the other materials.
Submitted by shahisandesh95 on

Unauthorized use and/or duplication of this material without express and written permission from this site’s author and/or owner is strictly prohibited. Excerpts and links may be used, provided that full and clear credit is given to Writing9 with appropriate and specific direction to the original content.

Basic structure: Write more paragraphs.
Basic structure: Add more body paragraphs.
Common mistake: Your writing should be 150-250 words.
Basic structure: Write more paragraphs.
Vocabulary: The word "fluctuations" was used 2 times.
What to do next:
Look at other essays: