
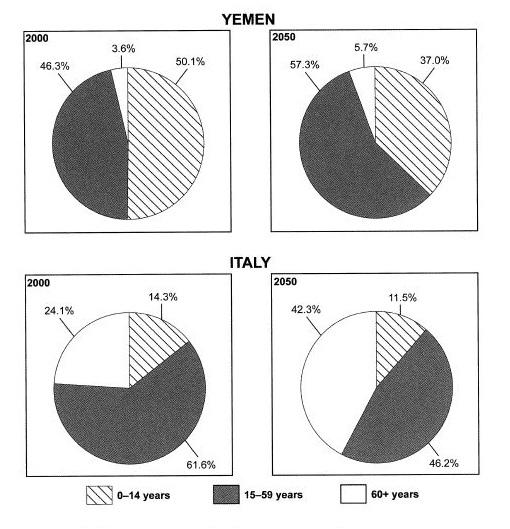
These pie charts show population data for two countries – Yemen and Italy. On the left, the pie charts show the nations’ demographics in 2000, and on the
right
they show projected figures for 2050. Both countries are estimated to undergo major changes in the age of their Add a comma
,right
people
.
In 2000, slightly over half of Yemeni Use synonyms
people
were in the youngest age group, which is less than fourteen Use synonyms
years
old. A little less than half are aged between fifteen and fifty-nine Use synonyms
years
old, and the remaining 3.6% of the public is sixty Use synonyms
years
old or more. Use synonyms
However
, it is projected that in 2050 the percentage of the public aged below fourteen Linking Words
years
will decline Use synonyms
while
the other two groups increase. There will be only 37% of the public aged less than fourteen Linking Words
years
, Use synonyms
while
the percentage aged fifteen to fifty-nine will grow to 57.3%.
Italy will follow a similar trend. Its youth population will decline from 14.3% to 11.5% Linking Words
while
the number of elderly Linking Words
people
nearly doubles. Use synonyms
However
, Linking Words
whereas
in Yemen the group of Linking Words
people
aged fifteen to fifty-nine grew, in Italy it will be somewhat reduced from nearly two-thirds to less than a half of the total Use synonyms
people
.Use synonyms