
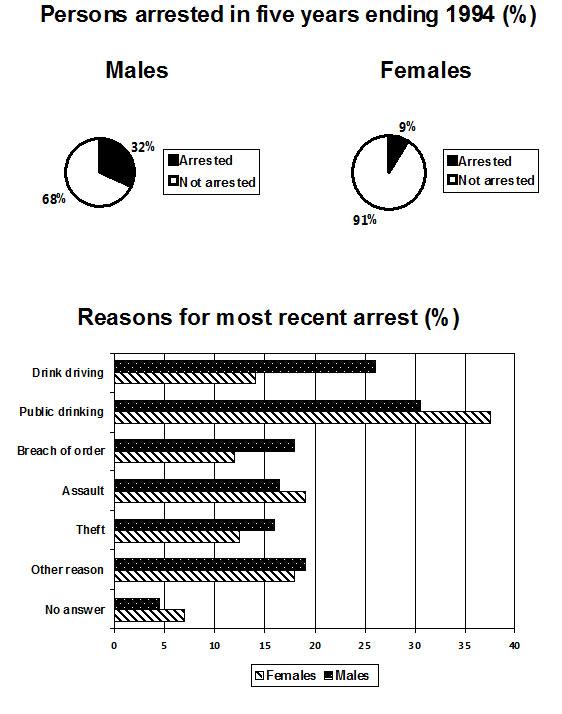
Information about the number of males and females arrested in a period starting from the year 1989 and ending in 1994 is presented by two pie charts in percentages.
Also
, the reasons for the arrests are shown by a bar chart in percentages.
Linking Words
Overall
, it is noticeable that Linking Words
men
tend to get jail time more than women. The percentage of males arrested for the five-year period is 32%. In comparison, the same data for females is drastically lower at only 9%.
The biggest reason for the conviction for both genders is public drinking, which accounts for the arrest of almost 40% of the women and around 30% of the Use synonyms
men
. A dramatic difference is present in the values for drunk driving, which was the reason for over 25% of the Use synonyms
men
's convictions. Use synonyms
On the contrary
, the same statistic has numbers over 10% lower for the other gender. Other four reasons, Linking Words
such
as assault and theft, have similar values of around 15% for males and between 12% and 17% for females. Less than 5% of the Linking Words
men
and close to 7% of the women gave no explanation as to why they were jailed.Use synonyms