
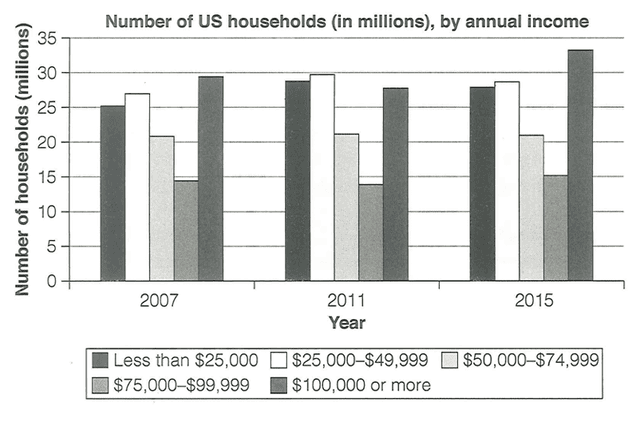
The illustrated bar graph below demonstrates the number of
households
Use synonyms
according
their annual Add the preposition
toaccording
income
in 2007, 2011 and 2015 in the US.
Looking from an Use synonyms
overall
perspective, Linking Words
it is clear that
Linking Words
income
distribution among US Use synonyms
households
displayed similar patterns in these three years, with more Use synonyms
households
in both the highest and the Use synonyms
two
lowest Use synonyms
income
brackets than Use synonyms
Use synonyms
two
middle brackets.
In both 2007 and 2015, the largest category consisted of Correct article usage
the two
households
that earn at least $Use synonyms
100.000
, reaching approximately thirty and Correct your spelling
100,000
thirty four
Add a hyphen
thirty-four
million
Use synonyms
households
. The Use synonyms
two
second-largest groups in Use synonyms
two
thousand seven and 2015 were those earning less than $25.000 and between $25.000 and $49.999. They both reached somewhere about Use synonyms
twenty five
to Add a hyphen
twenty-five
twenty eight
Add a hyphen
twenty-eight
million
Use synonyms
households
.
Use synonyms
However
, Linking Words
two
thousand eleven saw a different trend, as the Use synonyms
two
highest brackets contained a Use synonyms
great
number of Correct word choice
greater
households
than the highest range. In Use synonyms
this
year, about 28-30 Linking Words
million
Use synonyms
households
made either below $25.000 or $25.000-$49.999, Use synonyms
while
roughly speaking Linking Words
twenty seven
Add a hyphen
twenty-seven
million
Use synonyms
households
had a minimumUse synonyms
$
100.000 as an Change preposition
of $
income
.Use synonyms