the chart below gives information on the percentage of british people giving money to charity by age range for the years 1990 and 2010. summarise the information by selecting and reporting the main features and make comparisons where relevant

the chart below gives information on the percentage of british people giving money to charity by age range for the years 1990 and 2010. summarise the information by selecting and reporting the main features and make comparisons where relevant
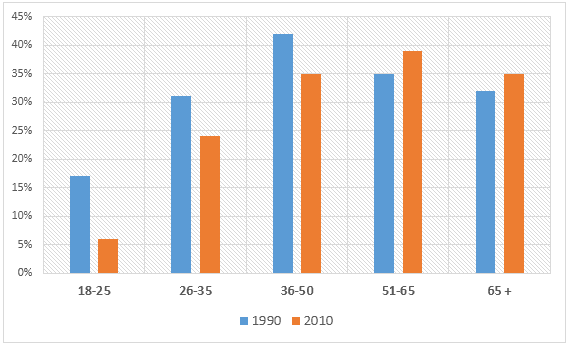
From the above chart, we can see the trend in the percentage of the British population, from the age range of eighteen to over sixty-five
years
, who gave charity between 1990 and 2010.  In 1990 the number of British people aged eighteen to twenty-five
years
more than doubled in portion, from up to fifteen per cent to slightly more than five per cent, compared to 2010. The same tendency is seen in the two following age groups, between the ages of twenty-six to thirty-five
years
and thirty-six to fifty
years
,
however
, the decrease is drastically less. In both age groups, the reduction in percentage is merely a bit more than five per cent,
moreover
, in the same ranges of ages, the
overall
amount of public doing charity in 2010 is still higher than the younger group.  Over fifty
years
old
this
tendency is inverse. In 2010 around four percent more people between the ages of fifty-one and sixty-five are granting money to the needy ones.  In the same way, the British over sixty-five
years
are more likely to concede charity in 2010 rather than in 1990,
although
the variation is meagre.
Submitted by valeria.pomante on

Unauthorized use and/or duplication of this material without express and written permission from this site’s author and/or owner is strictly prohibited. Excerpts and links may be used, provided that full and clear credit is given to Writing9 with appropriate and specific direction to the original content.

Basic structure: Change the fourth paragraph.
Vocabulary: Replace the words years with synonyms.
Vocabulary: The word "percentage" was used 2 times.
Vocabulary: Use several vocabularies to present the data in the fourth paragraph.
Topic Vocabulary:
  • charitable donations
  • age range/bracket/group
  • percentage (%)
  • 20-year period
  • British people
  • trends
  • increase/decrease
  • significant change
  • donation patterns
  • remained stable
  • highest/lowest
  • observe
  • compare
  • summarize
  • comment on
  • relevant features
What to do next:
Look at other essays: