
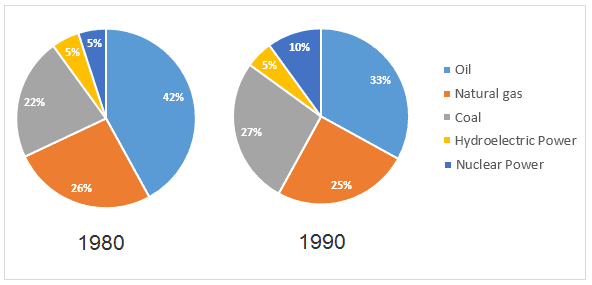
Given are two figures concerning the major sources of energy in the USA in the 1980s and a decade afterwards.
A glance at the pie charts provided reveals that oil was the most major part of the sources of energy
whereas
the negligible part Linking Words
was belonged
to hydroelectric power in the all surveyed years.
The highest amount of the sources was taken up by oil Change to the active voice
belonged
has belonged
accounted
for 42 Wrong verb form
accounting
Use synonyms
percent
and 33 Change the spelling
per cent
Use synonyms
percent
of the whole pie chart in 1980 and 1990 respectively. The second highest rate of energy generation in America was related to natural gas Change the spelling
per cent
accounted
for all but 51 Wrong verb form
accounting
percent
collectively in Use synonyms
1980s
and a decade afterwards.
1980, nuclear power and hydroelectric power took up Change the article
the 1980s
similar
proportion of 5 Add an article
a similar
Use synonyms
percent
of the whole pie chart and they were the least significant proportion. The prior witnessed an exponential increment and stood at 10% in 1990. Meanwhile, the latter remained still in 1990.Change the spelling
per cent