
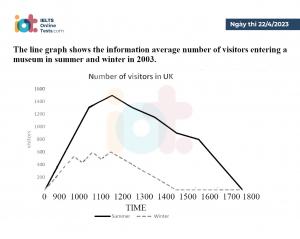
The line graph provides the data about amount of people visiting a
museum
during the Use synonyms
summer
and winter Use synonyms
season
in the year 2003.
Fix the agreement mistake
seasons
Overall
, it can be seen that most of the Linking Words
indivuals
like to visit the Correct your spelling
individuals
museum
in Use synonyms
summer
Use synonyms
instead
of visiting in winter and it is Linking Words
also
clear that people Linking Words
prefers
to come to the Correct subject-verb agreement
prefer
museum
in the early hours of the day Use synonyms
such
as from 9 am to 12 Linking Words
pm
.
Regarding the number of visitors in Use synonyms
summer
, it begins at 9 am and climbs rapidly to almost 1300 visitors till 10 am, Use synonyms
then
there is a slight increase between 10 am to 11 Linking Words
pm
reaching around 1500 visitors which is the highest number in Use synonyms
summer
and after it gradually starts decreasing from 12 Use synonyms
pm
to 16 Use synonyms
pm
, Use synonyms
then
drops more before closing.
In the winter Linking Words
season
it can be observed that people are less interested in visiting the Add a comma
,season
museum
as only 600 folks visit the Use synonyms
museum
from 9 am to 12 Use synonyms
pm
. Use synonyms
Then
the number dropped steadily till 15pm and remained stable at 18:00 Linking Words
pm
Use synonyms