
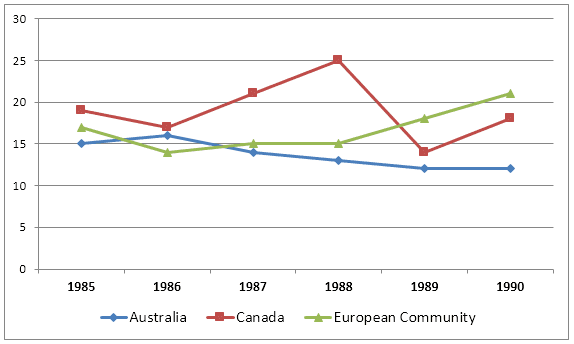
The line graph illustrates the differences in wheat exports over three countries namely
Australia
, Use synonyms
Canada
and the European Community from the year 1985 to 1990.
Use synonyms
Overall
, Linking Words
Australia
and Use synonyms
Canada
had a decline in their exports and the European Community had an increase by the end of the era.
In 1985, Use synonyms
Australia
and Use synonyms
Canada
had 15 and 19 million tonnes of wheat trade respectively. Use synonyms
Although
Linking Words
Canada
has more fluctuations it does not have Use synonyms
such
a huge loss as compared to Linking Words
Australia
. In the period , of 1988 it was the highest in exporting among other countries reaching 25 but Use synonyms
then
it sharply fell to about 14 in the term 1989 and Linking Words
then
gradually increased to 18 at the deadline of the era. Linking Words
Australia
slightly increased to 17 in the year 1986 but since Use synonyms
then
it slowly reduced to 12 million tonnes by the year 1989. From 1989-1990 the Australian wheat trading was steady.
At the beginning of the stretch European Community had almost 17 million tonnes but over the term it reached 15 in the period 1988. From 1988 it started to increase sharply and it reached 21 by the end of the cycle and it was the highest among all the three countries by the end of the cycle.Linking Words