
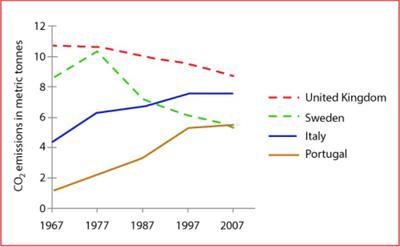
The line chart illustrates the minimum use of CO2 emission in metric tonnes by individuals in four different countries in the years 1967 to 2007.
Overall
, at the start of the Linking Words
,
Remove the comma
apply
year
the United Kindom was using the highest CO2 Use synonyms
while
Italy rapidly grew throughout the years. we can fluctuation all nations.
As per the line chart, the highest individual was using the co2 emission in the United Kingdom around 10.5 in 1967 followed by Sweden at almost 8.5. Linking Words
However
, Sweden faced an upward trend of about 4 in the Linking Words
year
1977 and the United Kingdom dropped by 1. Use synonyms
Furthermore
, Sweden dropped down throughout the Linking Words
year
approximately 10 in 2007 and the United Kingdom decreased by 4.
Use synonyms
On the other hand
, Italy and Portugal were the lowest in 1967 nearly 1 and 4. Both countries significantly experienced growth in the past Linking Words
year
and reached 5 and 7. Use synonyms
Nevertheless
, once they reached in the Linking Words
year
2007 Italy dramatically increased and reached 8 and Portugal 6.Use synonyms