
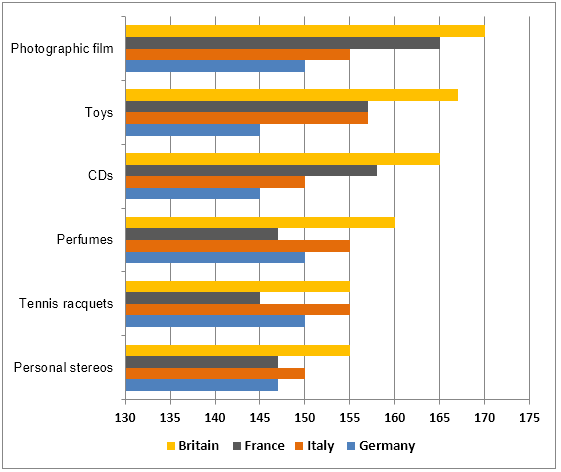
The bar chart compares the spending of 4 different countries on 6 various products.
Overall
, Britain is the largest consumer market in each category Linking Words
while
Germany is the collectively smallest one. Linking Words
Moreover
, photographic film is the most popular goods altogether.
Linking Words
To begin
with, British citizens spend about £170 Linking Words
thousand
on graphic movies, about 5.000 more than the French, the second major buyer of Use synonyms
this
item. Customers in Britain Linking Words
also
allocate a large amount from their budget for toys about £Linking Words
165.000
Correct your spelling
165,000
while
those in France and Italy each spend almost £160 Linking Words
thousand
. The sales of CD and perfumes in Britain is Use synonyms
also
high, at 162 and 160.000 pounds respectively. Linking Words
Although
less than £160.000 from Linking Words
this
country goes to the remaining, it is still the number one consumer of them.
Linking Words
By contrast
, Germany is the country with the least expenditure of all on the above-mentioned stuff. The Germans spend no more than £150 Linking Words
thousand
on each kind of goods. Use synonyms
Besides
, France’s spending is higher than Italy’s on CDs and photographic film, but the opposite is true for tennis racquets, perfumes and personal stereos, for which Italy overtakes France as the second largest market. In fact, the payments by the French on those things are the lowest, with around £145, 146 and 147 Linking Words
thousand
respectively.Use synonyms