
This
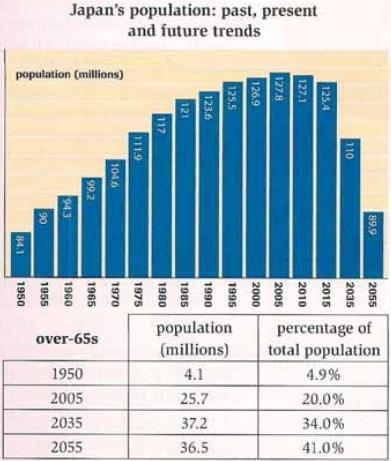
line graph illustrates the number of people in Japan over a 100-year period. The table shows the percentage and figure of the elderly population who are over 65 years old. Linking Words
Overall
, we can see that the percentage of elderly has increased over time and will be over 41% in the future.
In population view, the number of Japanese significantly increased from 84.1m in 1950 and reached a peak of 127.8m in 2005. Linking Words
However
, after it had reached a peak, it started to drop. From the prediction, the population will dramatically fall to 89.9m in 2055 which is nearly the same figure as 1955.
Moving to the elderly who are over 65 years old, there was a sharp growth in terms of percentage from only 4.9% in 1950 to 34% in 2035. Linking Words
Moreover
, it will slightly decrease in terms of numbers from 37.2m to 36.5m, but if we focus in term of proportion, it will rise from 34% to 41%.Linking Words