
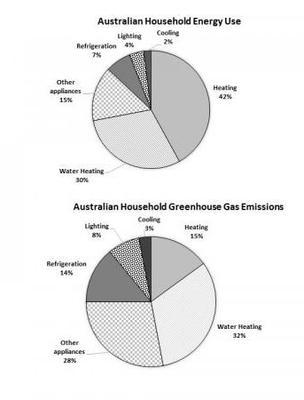
The graph illustrates two pie charts, the
one
above shows the amount of energy used by a standard Australian family. Use synonyms
Furthermore
, the Linking Words
one
below reveals the greenhouse Use synonyms
gas
Use synonyms
emissions
, which stem from Use synonyms
this
power use.
On the Linking Words
one
hand, the vast majority of the first chart is covered by the energy consumed for heating and water heating, which reaches respectively forty-two and thirty per Use synonyms
cent
. Use synonyms
Moreover
, the remaining portions of the pie are taken by features Linking Words
such
as other appliances, refrigeration, lighting and cooling, in decreasing order of percentage from fifteen to two per Linking Words
cent
.
Use synonyms
On the other hand
, though, the figure that tells us about greenhouse Linking Words
gas
Use synonyms
emissions
does not match the diagram on top. In fact, unlike the first graph, the carbon Use synonyms
emissions
caused by the heating amount to fifteen per Use synonyms
cent
only, Use synonyms
while
the Linking Words
one
brought by other appliances, rises to the value of twenty-eight. Use synonyms
Whereas
, the Linking Words
gas
discharge resulting from water heating, lighting and cooling corresponds to the energy use. Use synonyms
Lastly
, Linking Words
one
important point of mention is the twofold increase in the percentage of Use synonyms
gas
Use synonyms
emissions
for refrigeration, which goes from seven to fourteen per Use synonyms
cent
.Use synonyms