
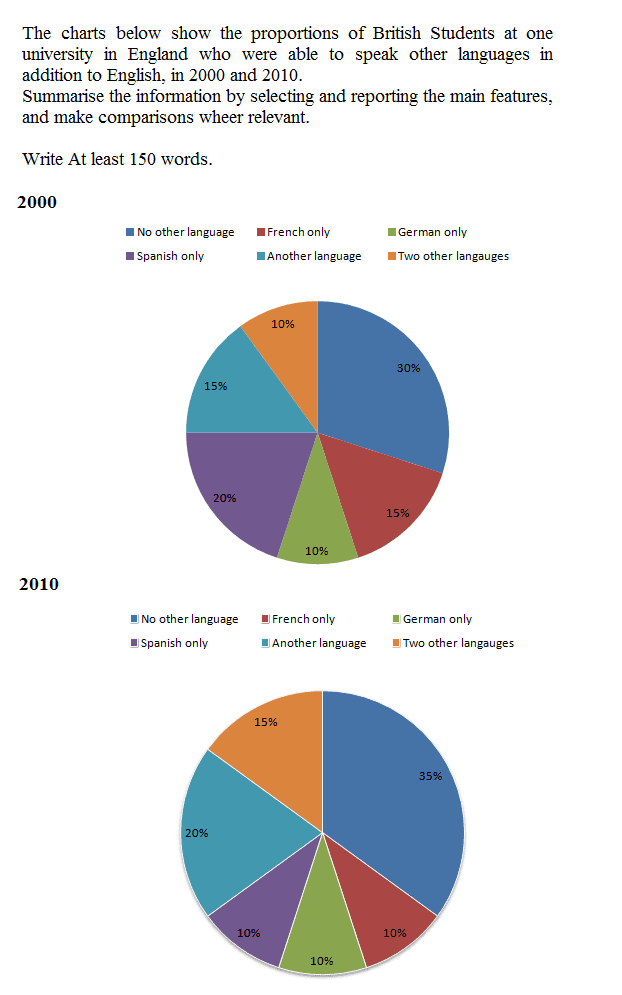
The display pie charts illustrate the portion of students at one university in the UK who can speak other languages
besides
English, in the years 2000 Linking Words
as well as
2010.
In industrial Linking Words
use
, North Use synonyms
America
was 48%, South Use synonyms
America
was 10%, Use synonyms
Europe
was 53%, Use synonyms
Africa
was 7%, Central Use synonyms
Asia
was 5% and South East Use synonyms
Asia
was 12%. In agricultural Use synonyms
use
, North Use synonyms
America
was 39%, South Use synonyms
America
was 71%, Use synonyms
Europe
was 32%, Use synonyms
Africa
was 84%, Central Use synonyms
Asia
was 88% and South East Use synonyms
Asia
was 81%. In domestic Use synonyms
use
, North Use synonyms
America
was around 15%, South Use synonyms
America
was 19%, Use synonyms
Europe
was 15%, Use synonyms
Africa
was 9%, Central Use synonyms
Asia
was 7% and South East Use synonyms
Asia
was 7%. The is a great difference in North Use synonyms
America
, South Use synonyms
America
, Use synonyms
Europe
, Use synonyms
Africa
, Central Use synonyms
Asia
and South East Use synonyms
Asia
.
Use synonyms
To conclude
, the above information shows the industrial Linking Words
use
, agricultural Use synonyms
use
and domestic Use synonyms
use
, in North Use synonyms
America
, South Use synonyms
America
, Use synonyms
Europe
, Use synonyms
Africa
, Central Use synonyms
Asia
and South East Use synonyms
Asia
.Use synonyms