
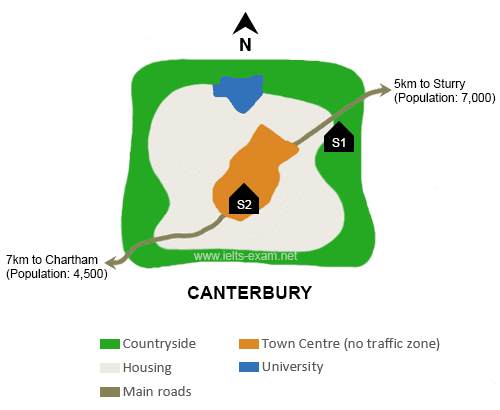
The given map illustrates the data of Canterbury City where a brand-new institution is going to be constructed with various suggestive opinions for the school location.
From an
overall
perspective, it is clear from the diagram that both locations are paralleled with the main pathway but S1 would be presented in the countryside area Linking Words
whereas
the other could be implemented at approximately the heart of the city centre.
Looking at the details, it is remarkable that S1 is about to be built in a greenfield apart from the town centre with the positive consequences of being close to the Sturry land which has a population of seven thousand. Linking Words
Furthermore
, at Linking Words
this
,position the University is on the northwest of the school.
Comparably, S2, it is noticeable that the current neighbourhood of S2 is the best place since it is going to be located near the square which is surrounded by many residential facilities. Unfortunately, the only negative consequence of Linking Words
this
community is that the traffic is completely closed and far away from the nearest city like the Chartham with 4500 citizens.Linking Words