
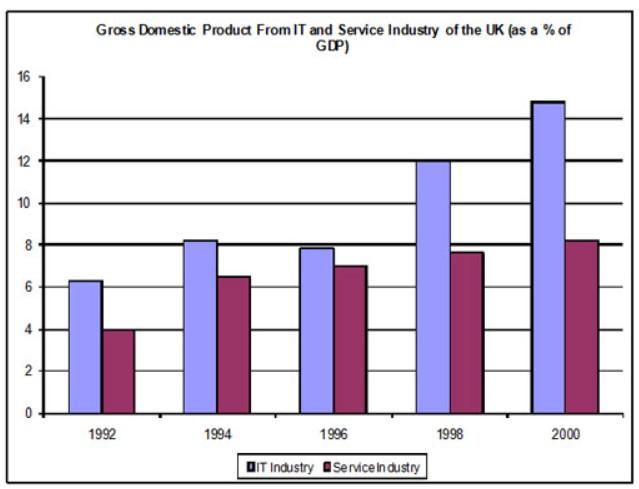
The bar chart illustrates the gross domestic product generated by the IT
industry
and the Use synonyms
Service
Use synonyms
industry
of the UK between the years 1992 and 2000. It is measured in percentages.
Use synonyms
Overall
, it can be seen that both IT and Linking Words
Service
industries increased as a rate of Use synonyms
GDP
by the end of the period, but IT remained at a higher rate throughout the time, Use synonyms
although
there is a slight fluctuation.
At the beginning of the period, in 1992, the IT Linking Words
industry
accounted for over 6 per cent of Use synonyms
GDP
. Use synonyms
Moreover
, IT just fell below 8% from being slightly above it. Linking Words
Then
, It drastically grew by one and half times more than what it was in the previous year and reached approximately 15 per cent by the end of the given time.
Linking Words
In contrast
, At the beginning of the times shown in the table, the Linking Words
Service
Use synonyms
industry
contributed less to the Use synonyms
GDP
compared to IT. Between 1992 and 1994 there was a significant growth of over 2 per cent for the Use synonyms
service
Use synonyms
industry
. Use synonyms
However
, it still made the least contribution to the gross domestic product and by the year ,2000 IT made almost twofold times more contribution to the Linking Words
GDP
.Use synonyms