The two pie charts below show the percentages of industry sectors' contribution to the economy of Turkey in 2000 and 2016. Summarize the information by selecting and reporting the main features, and make comparisons where relevant.

The two pie charts below show the percentages of industry sectors' contribution to the economy of Turkey in 2000 and 2016.

Summarize the information by selecting and reporting the main features, and make comparisons where relevant.
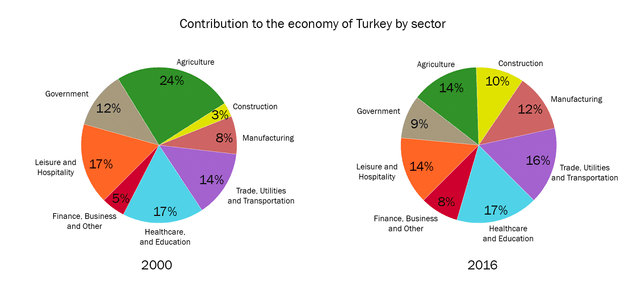
The display two pie charts show the percentages of industry sectors' contribution to the economy of Turkey in 2000
as well as
2016. The information is on Turkey. In the year 2000, in agriculture it was the highest at 24%, in construction it was 3%, in manufacturing it was 8%, in trade, cities and transportation it was 14%, in healthcare, education, leisure and hospitality it was 17%, in finance, business and other it was 5% and in ,government it was 12%. In the year 2016, in construction it was 10%, in manufacturing it was 12%, in trade, utilities and transportation it was 16%, in healthcare and education it was the highest at 17%, in finance, business and others it was 8%, in leisure and hospitality it was 14%, in ,government it was 9% and in ,agriculture it was 14%.
To conclude
, the above information describes the contribution to the economy of Turkey by 8 sectors in the years 2000 and 2016.
Submitted by purvaam383 on

Unauthorized use and/or duplication of this material without express and written permission from this site’s author and/or owner is strictly prohibited. Excerpts and links may be used, provided that full and clear credit is given to Writing9 with appropriate and specific direction to the original content.

Sentences: Add more complex sentences.
Vocabulary: Rephrase your introduction. Words match: 89%.
Vocabulary: Rephrase the word "percentages" in your introduction.
Vocabulary: Only 6 basic words for charts were used.
Vocabulary: The word "information" was used 2 times.
What to do next:
Look at other essays: