The table below shows the results of surveys in 2000, 2005 and 2010 about one university. Summarise the information by selecting and reporting the main features, and make comparisons where relevant.

The table below shows the results of surveys in 2000, 2005 and 2010 about one university.

Summarise the information by selecting and reporting the main features, and make comparisons where

relevant.
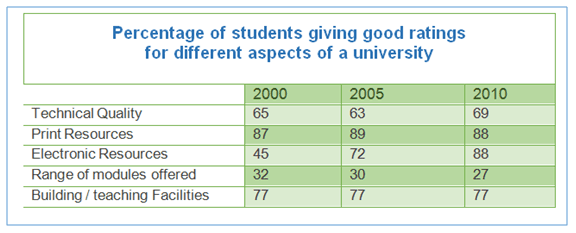
The supplied illustration gives information about observations in various
years
in one university.
Overall
, almost all aspects of a university have an improvement in each year, on the
contrary
Add the comma(s)
,contrary
show examples
the range of modules offered declined every period in the table. As can be seen, teaching quality had a small decrease from 65 per
cent
in 2000 to 63 in 2005, but despite
this
factor after five
years
Add a comma
,years
show examples
measurement had risen like never before. The print resources had a percentage of over 80% every time period. Meanwhile, electronic resources rocketed from 45 per
cent
in 2000 to 72 per
cent
in 2005, and
then
climbed to 88 per
cent
after 5
years
.
However
, the modules that were offered by the university were 32 in 2000,
then
slightly fell to 30,
after
this
in 2010 percentage declined again to 27. At the same time number of buildings or facilities that was used for teaching remained constant over the period and accounted for 77 per
cent
of all 10
years
.
Submitted by aikumarbekarys on

Unauthorized use and/or duplication of this material without express and written permission from this site’s author and/or owner is strictly prohibited. Excerpts and links may be used, provided that full and clear credit is given to Writing9 with appropriate and specific direction to the original content.

Introduction: The introduction is missing.
Introduction: The chart intro is missing.
Basic structure: Use less body paragraphs.
Basic structure: Change the fifth paragraph.
Introduction: The chart intro is missing.
Vocabulary: Replace the words years, cent with synonyms.
Vocabulary: Rephrase the word "information" in your introduction.
Vocabulary: The word "percentage" was used 2 times.
Vocabulary: The word "declined" was used 2 times.
Vocabulary: Use several vocabularies to present the data in the fifth paragraph.
Topic Vocabulary:
  • survey
  • results
  • university
  • 2000
  • 2005
  • 2010
  • main features
  • comparisons
  • relevant
  • trends
  • responses
  • time
  • significance
What to do next:
Look at other essays: