
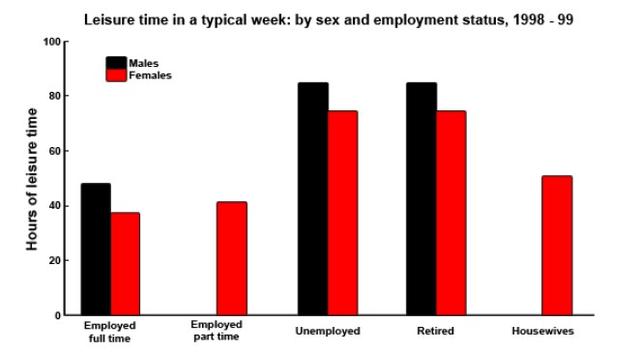
The bar chart above depicts the number of enjoying relaxation moments by two sexes of 5 different employment statuses,
such
as employed, part-time working, unemployed, retired, and housewives.
At first glance, the level of unemployed and retired men is the same, and have more points for leisure Linking Words
while
employed individuals have much fewer. Linking Words
In addition
, women in retiring or unemployed positions have a bit less term than other genders Linking Words
while
those who are employed or working a part-time job have almost the same levels.
Linking Words
To begin
with, males without a job or who finished a career have the highest level of chilling time, at 80%. Meanwhile, the working man has much less free duration having only 50%. Linking Words
Also
, it is noticeable that men do not work at part-time jobs and can not be housewives.
Linking Words
On the other hand
, women have less in every statistic, Linking Words
for instance
, females who are retired or unemployed have 75% respectively. With full-time or part-time there is a small difference in favour of part-time, peaking at 40% Linking Words
while
housewives have 60% of enjoying leisure occasions only.Linking Words