
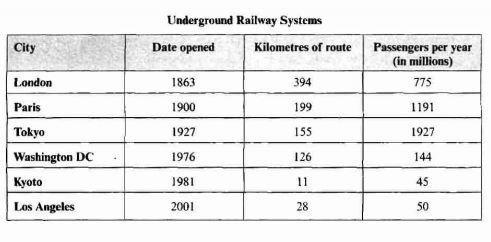
The table provides underground railway systems information in six different cities based on the date opened,
kilometres
of route, and Use synonyms
passengers
per Use synonyms
year
(in millions). Use synonyms
Overall
, Washington DC has the highest route development per Linking Words
year
. Use synonyms
In addition
, Tokyo services more Linking Words
passengers
than others and has the highest proportion of Use synonyms
passengers
per Use synonyms
kilometre
per Use synonyms
year
, Use synonyms
while
Kyoto is the less crowded underground train system and Los Angeles scored the lowest services in Linking Words
passengers
per Use synonyms
kilometre
per Use synonyms
year
.
Use synonyms
To begin
with, Linking Words
although
the system was built in 1976, Washington DC experienced the highest rate of route creation per Linking Words
year
with almost 3 Use synonyms
kilometres
per Use synonyms
year
, followed by London (approximately 2,5 Use synonyms
kilometres
per Use synonyms
year
), Paris and Tokyo (slightly under 1,5 Use synonyms
kilometres
per years), Los Angeles (roughly 1 Use synonyms
kilometre
per years), and Kyoto (below 0,5 Use synonyms
kilometres
per years).
Use synonyms
In addition
, Tokyo is marked as the pinnacle in Linking Words
passengers
per Use synonyms
year
with 1927 Use synonyms
million
per Use synonyms
year
and almost 12 Use synonyms
million
Use synonyms
passengers
per Use synonyms
kilometre
per Use synonyms
year
, and Kyoto is the lowest with 45 Use synonyms
million
Use synonyms
passengers
per Use synonyms
year
. Yet, Los Angeles scored the lowest passenger per Use synonyms
kilometre
per Use synonyms
year
with no more than 2 Use synonyms
million
.Use synonyms