
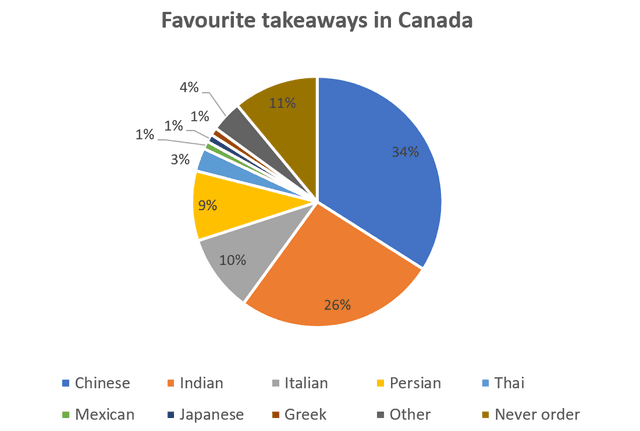
The pie chart illustrates the rate of the best fast
food
for people in Canada and Use synonyms
also
shows the
best Linking Words
food
type for people. Use synonyms
Linking Words
Furthermore
the pie chart shows Add a comma
Furthermore,
the
load of Indian restaurants in
Canada between 1960 and 2015.
Change the article
a
Overall
the proportion of Chinese shows that people love Chinese fast Linking Words
food
more than
another sort of Use synonyms
food
.Use synonyms
In contrast
, there are three countries that show low percentages Linking Words
As
Japan, Change preposition
apply
Greek
and Mexican.
Looking in more detail, the highest chunk Correct your spelling
Greece
were
for Chinese and Change the verb form
was
Indian
the percentages were 34 %, and 26% respectively. Replace the word
Indians
Moreover
, the other types of Linking Words
food
appeared close percentage as Italian, Persian and the type of favourite takeaways which is never ordered, the percentages were 10%,9%,and Use synonyms
11%respectively
. Correct your spelling
11 %respectively
Also
, there are three types of Linking Words
countries
Change noun form
countries'
country's
food
showing the same % which was 1%.
On Use synonyms
other
hand, the number of Indian restaurants shows a different bulk in all years, Correct article usage
the other
firstly
in 1960 the number was about 300 and after 10 years the Linking Words
amount
has increased to around 1000 Use synonyms
then
in
1980 the Linking Words
amount
shows Use synonyms
rocketed
Increase it is extant to around 3000 Correct article usage
a rocketed
also
for 1990 there was Linking Words
clear
increase the Correct article usage
a clear
amount
was around 5000 Use synonyms
then
from 1997 to 2015 the Linking Words
amount
was very close it was between 7900 Use synonyms
to
9000.Correct word choice
and