
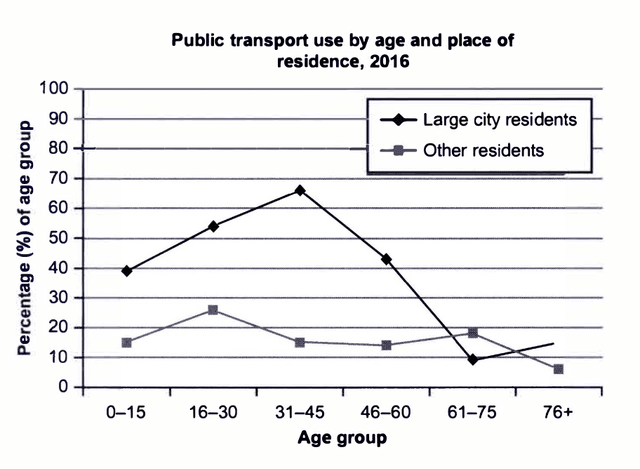
The graph illustrates a clear difference in the pattern of public the beginning to the other residents we can see that in
transport
utilisation between people who live in large Use synonyms
cities
Use synonyms
as well as
other citizens in 2018.
To summarize, it is evident that in large citizens Linking Words
transport
role is more crucial than the other residents.Use synonyms
Thus
line utilisation in that area shows high degrees between adults Linking Words
as well as
youngsters.
Linking Words
To begin
with, the most popular ages of utilizing the transportation system is in several cases of ages. Linking Words
For example
Linking Words
Add a comma
,
using
public Change preposition
of using
transport
between 0 and 30 has been popular in large Use synonyms
cities
these degrees more than the other residents.
Use synonyms
Furthermore
, we can see that the majority living in large Linking Words
cities
are not only popular among youngsters or adults but Use synonyms
also
in Linking Words
this
graph shows 31 and 45 as Linking Words
this
argument significantly increased after several ages. As soon as Linking Words
according to
holders in Linking Words
this
type we can understand Linking Words
this
type of public Linking Words
transport
is not popular in large Use synonyms
cities
as the line of Use synonyms
this
dramatically decreased 10.
Linking Words
To sum up
Linking Words
Add a comma
,
this
are majority not fond of utilising public transports. Since the lines of Linking Words
this
show dramatically decreasing during the period.Linking Words