
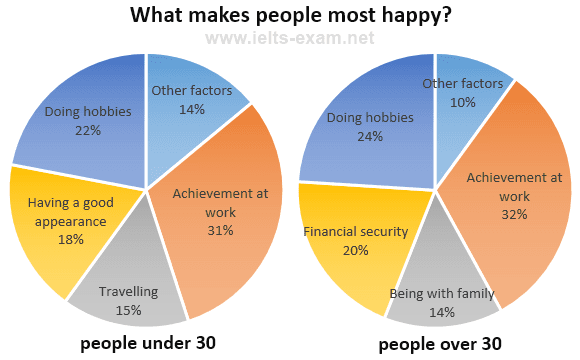
The charts display data from a survey about what makes
people
feel happiest. It is split into two graphs where each of the graphs displays two different Use synonyms
age
groups, Use synonyms
people
above 30 and Use synonyms
people
under 30.
Use synonyms
Overall
, for both Linking Words
age
groups accomplishment at work makes them feel happiest. Meanwhile, the other Use synonyms
factors
both bring Use synonyms
people
the least enjoyment. The Use synonyms
last
3 Linking Words
factors
that make up the pie chart are different for both groups.
Use synonyms
To begin
with the under-30 Linking Words
group
Use synonyms
Rephrase
apply
first,
31% of the participants chose that success in their work-life brings them the most fulfilment. Linking Words
This
is Linking Words
then
followed by chasing their hobbies and having good looks, which clocks in at 22% and 18% of Linking Words
people
surveyed respectively. The second to Use synonyms
last
factor is travelling, with 15% of participants opting for Linking Words
this
option. The other Linking Words
factors
Use synonyms
then
came in Linking Words
last
at 14% only.
Moving on to the over 30 Linking Words
group
, where it seems Use synonyms
this
Linking Words
age
Use synonyms
group
values their work more there is a 1% difference in the percentage of Use synonyms
people
that chose work achievement, bringing it up to 32%. Use synonyms
Then
it's indulging in their personal interests. Linking Words
This
option experienced a 2% increase in the number of Linking Words
people
that chose it compared to the other Use synonyms
age
Use synonyms
group
, sitting at 24%. Use synonyms
Following
Linking Words
this
is financial security at 20%, spending time with their families at 14% and Linking Words
finally
other Linking Words
factors
at 10%.Use synonyms