The charts below show the results of a survey about what people of different age groups say makes them most happy. Summarise the information by selecting and reporting the main features, and make comparisons where relevant.

The charts below show the results of a survey about what people of different age groups say makes them most happy.

Summarise the information by selecting and reporting the main features, and make comparisons where relevant.
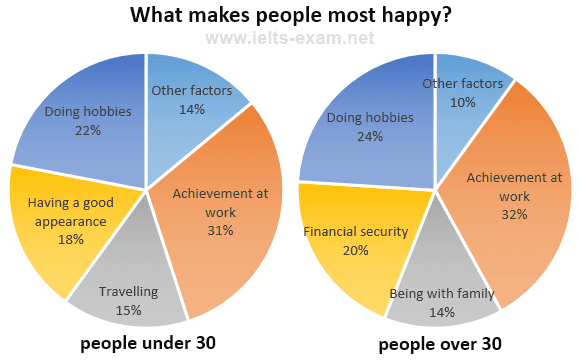
The pie charts compare different factors affecting the happiness of two age groups, which are under and above 30 years old. Overview, work accomplishment and doing hobbies are two common reasons making
people
of all ages happy.
While
people
aged under 30 cares more about their appearance, the other group focuses more on their financial capability.
To begin
with, work achievement is what makes
people
happy the most, accounting for over 30% of all
indivduals
Correct your spelling
individuals
taking part in the survey.
This
is followed by
the
Correct article usage
apply
show examples
enjoyment when doing hobbies, which makes up
of
Change preposition
apply
show examples
22% and 24% of
people
below 30 and above 30, respectively.
However
, these two groups of age
also
have different concerns that can impact their happy feeling. Appearance and travelling are important to individuals under 30, accounting for 18% and 15%.
In contrast
, 20 % of
people
aged over 30 think that financial security and 14% of them consider being able to spend time with family make them happy.
Submitted by duongngocminh260801 on

Unauthorized use and/or duplication of this material without express and written permission from this site’s author and/or owner is strictly prohibited. Excerpts and links may be used, provided that full and clear credit is given to Writing9 with appropriate and specific direction to the original content.

Basic structure: Change the third paragraph.
Basic structure: Change the fourth paragraph.
Vocabulary: Replace the words people with synonyms.
Vocabulary: Only 3 basic words for charts were used.
Vocabulary: Use several vocabularies to present the data in the third paragraph.
Vocabulary: Use several vocabularies to present the data in the fourth paragraph.
Topic Vocabulary:
  • survey
  • age groups
  • responses
  • happiness factors
  • participants
  • contribute
  • compare
  • patterns
  • differences
What to do next:
Look at other essays: