
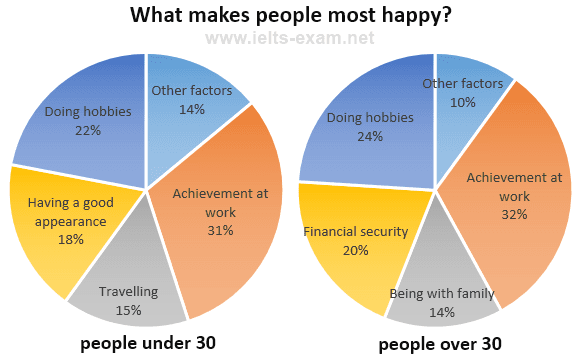
The provided graphics illustrate the outcome of a questionnaire conducted among two different
age
Use synonyms
groups
: people under and over 30, regarding the activities that make them most happy. The pie charts are divided into five different categories individually.
At a fleeting glance, it is evident that Use synonyms
both
Use synonyms
age
Use synonyms
groups
enjoy their employment, and the highest percentage across the charts is related to achievement at work, with an almost equal portion for Use synonyms
both
Use synonyms
age
Use synonyms
groups
. Notably, the Use synonyms
category
doing hobbies from Use synonyms
both
charts reveals a striking similarity in activity distribution.
Use synonyms
According to
the given information, it can be observed that achievement at work constitutes the maximum portion of happiness for Linking Words
both
Use synonyms
age
Use synonyms
groups
, which is 31 per cent and 32 per cent respectively. Turning our attention to the second set of data, other factors and travelling activities contribute a similar proportion of happiness to individuals under thirty. Notably, just under one-fifth of those under 30 are happy Use synonyms
due to
having a good appearance, Linking Words
while
the doing hobbies Linking Words
category
constitutes 22% of the total segment.
The second pie chart depicts that doing hobbies stands out as the second-largest Use synonyms
category
, surpassing being with family by 10% in terms of what brings happiness to people over 30. Use synonyms
Additionally
, the financial security Linking Words
category
is precisely double the value of other factors, which is 20% and 10% respectively.Use synonyms