
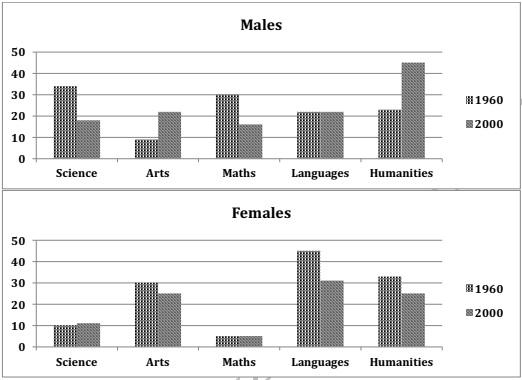
The bar graphs illustrate the proportion of
students
achieving peak grades in different Use synonyms
subjects
based on their genders between 1960 and 2000.
Use synonyms
Overall
, females demonstrated a significant success Linking Words
on
languages Change preposition
in
while
getting top scores from different Linking Words
subjects
generally saw a noticeable decrease. Use synonyms
On the other hand
, male Linking Words
students
exhibited an important progress on humanity and arts Use synonyms
subjects
.
In terms of maths and Use synonyms
s cience
, female Correct your spelling
science
students
showed unsuccessful performance based on getting top scores. Their mathematics scores fluctuated at 5 individuals from 1960 to 2000; Use synonyms
however
, science barely increased to just higher Linking Words
10
people. Change preposition
than 10
Conversely
, approximately 45 Linking Words
students
achieved a peak score Use synonyms
on
languages in 1990 before falling to 30 Change preposition
in
students
four decades later. Use synonyms
Although
their arts and Linking Words
humatities
Correct your spelling
humanities
subjects
experienced a slight decrease, their top graders were around 25 Use synonyms
students
in 2000.
Science and maths Use synonyms
subject
' top grader proportions Fix the agreement mistake
subjects
decrease
from around 30% to just below 20% throughout the period. Wrong verb form
decreased
Moreover
, the Linking Words
languages
performance of male Change the noun form
language
students
stayed constant at nearly 20%. One significant progress was their success Use synonyms
on
humanities Change preposition
in
subject
which was just higher than 20% before escalatingFix the agreement mistake
subjects
a
peak of 45% in 2000.Change preposition
to a