
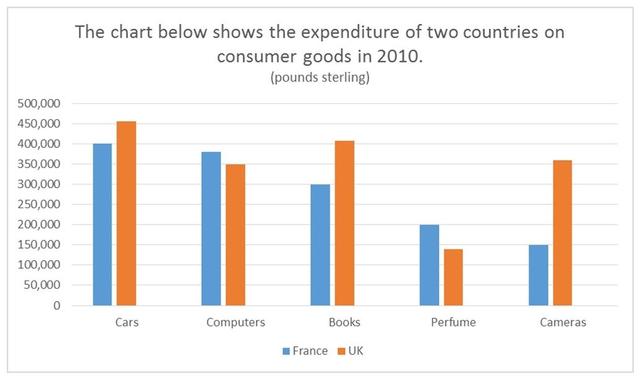
The bar chart below illustrates the consumer spending on goods in
France
and the Use synonyms
UK
in 2010.
Use synonyms
Overall
, both Linking Words
France
and the Use synonyms
UK
spent the most money on cars and computers. Use synonyms
Additionally
, spending on cameras in the Linking Words
UK
is especially high, Use synonyms
while
in Linking Words
France
it is the lowest.
In 2010, cars were the goods that shared the highest spending in Use synonyms
France
at about 100,000 compared to the Use synonyms
UK
, which witnessed an amount of money at around 450,000. Use synonyms
Similarly
, the Linking Words
UK
spent more money on books than Use synonyms
France
followed by books at 300,000 and 400,000. In the Use synonyms
UK
, the expenditure on cameras was around 350,000, which was double that of Use synonyms
France
, which was only 150,000.
The expenditure on perfume in the Use synonyms
UK
came Use synonyms
last
, with nearly 150,000, and in Linking Words
France
, the spending on it is 2 times lower than the spending on books. Both nations spent the most on computers, which shared the same amount of spending, which was around 300,000.Use synonyms