
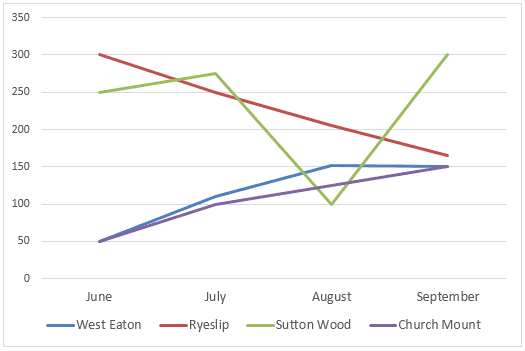
The given line graph illustrates the outcome of many
books
borrowed from four different libraries in the June, July, August, and September months of 2014.
From an Use synonyms
overall
perspective, Linking Words
while
a high number of rented Linking Words
books
belonged to Sutton Wood Library in September, a lower amount of them was observed in West Eaton and Church Mount libraries.
As shown in the details, the Ryeslip library had a significant decrease from 300 Use synonyms
books
in June to approximately 160 Use synonyms
books
in September. Use synonyms
On the contrary
, the trend of borrowed acts in Sutton Wood library had a sharp fluctuation from 250 Linking Words
books
to 300 Use synonyms
books
during four months.
Use synonyms
Moreover
, the case of West Eaton and Church Mount showed similar trends. Even though, two libraries had a gradual rise from 50 rented Linking Words
books
in June to 150 borrowed Use synonyms
books
in the Use synonyms
last
mentioned month. Indeed, these places had a lower borrowed number of Linking Words
books
compared to Ryeslip and Sutton Wood.Use synonyms