
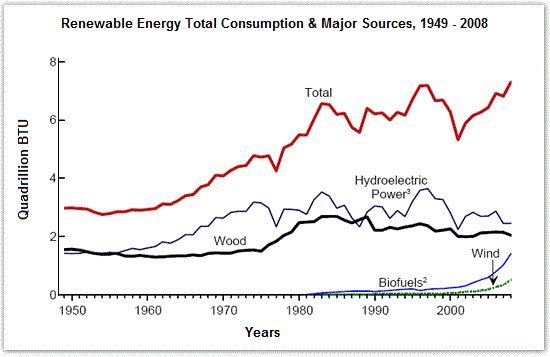
The diagram, which has great detail, illustrates sustainable energy utilization growth by source in the USA between 1949 and 2008.
Overall
, it is registered to be an improvement in the use of power sources in the course of almost 50 years. Linking Words
Therefore
, the total allotment of joules evidences Linking Words
this
increase in the chosen depiction.
Linking Words
Although
all resources have almost doubled their numbers in terms of usage, there are some whose evolution has been more prolific. Linking Words
For instance
, biofuels and wind nearly doubled their results Linking Words
at the end
of the selected period of time, starting with a rate of 0 and reaching 1 and 0.5 quadrillion Btu in 2008. Contrarily, the mid-1980s were the most popular years for using wood and hydroelectricity. They have now both tailed off to their 1950’s total.
Linking Words
To sum up
, on a general scale biofuels and wind will replace wood and hydroelectric, Linking Words
in particular
biofuels, which have experienced a steady upturn.Linking Words