
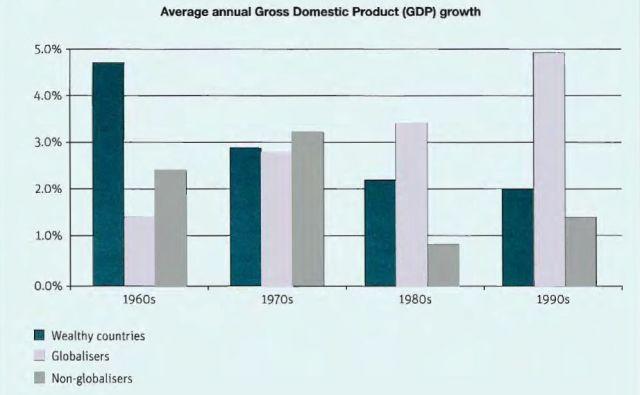
The given bar chart illustrates data on the average development of yearly
dosmestic
Correct your spelling
domestic
product
in developed, developing, Fix the agreement mistake
products
underdeveloped
Correct word choice
and underdeveloped
countries
from Use synonyms
1960s
to Change the article
the 1960s
1990s
. It shows that there Correct article usage
the 1990s
were
Correct subject-verb agreement
was
Correct article usage
a decreased
decreased
Replace the word
decrease
of
Change preposition
in
growth
in developed Use synonyms
countries
, increased and fluctuated of Use synonyms
growth
in developing and underdeveloped Use synonyms
countries
respectively.
Use synonyms
As the
presented bar chartChange preposition
The
,
starts with wealthy Remove the comma
apply
countries
. In Use synonyms
1960s
there Change the article
the 1960s
were
approximately 4.7% of average GDP Correct subject-verb agreement
was
growth
which is the highest Use synonyms
growth
throughout other states. The Use synonyms
numbert
kept decreasing and reached 2% in Correct your spelling
numbers
number
1990s
.
In Change the article
the 1990s
globaliser
states, there Correct your spelling
globalised
were
about 1.2% of GDP in the first 10 years of recorded data which Correct subject-verb agreement
was
were
the lowest amount of Correct subject-verb agreement
was
growth
throughout 40 years. The number kept increasing and reached 5% of Use synonyms
growth
in Use synonyms
1990s
.
In Change the article
the 1990s
non-globaliser
Correct your spelling
non-globalised
non-globalized
countries
, 2.2% of Use synonyms
growth
in Use synonyms
1960s
. The amount Change the article
the 1960s
were
fluctuated and reached 3.1% in Unnecessary verb
apply
1970s
which is the highest Change the article
the 1970s
growth
in these Use synonyms
state
throughout 40 years. After that, the number Fix the agreement mistake
states
were
decreased and reached 1.2% in Unnecessary verb
apply
1990s
.Change the article
the 1990s