
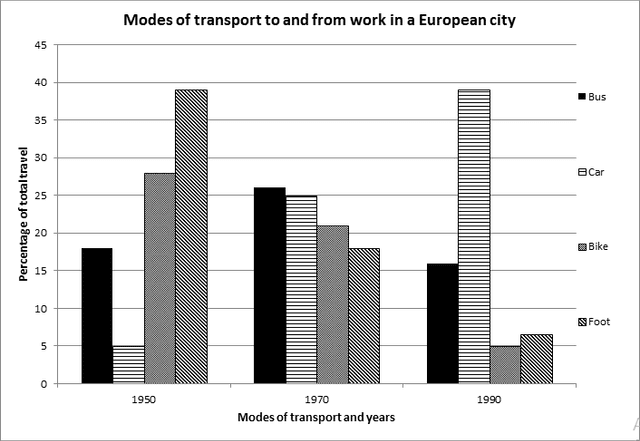
The given bar chart illustrates
that
the Correct word choice
apply
change
trend in chosen transport type by individuals Change the verb form
changing
betwee
1950 and 1990, in Correct your spelling
between
European
Add an article
a European
the European
country
.
Fix the agreement mistake
countries
Overall
, Linking Words
it is clear that
Linking Words
while
the preference of using bike and walking gradually decreased, car Linking Words
using
steadily increased. Wrong verb form
use
Additionally
, there was a fluctuation in Linking Words
the
bus usage the percentage of bus usage decreased slightly Correct article usage
apply
througout
Correct your spelling
throughout
period
.
Looking more closely at Correct article usage
the period
Correct article usage
the preferance
preferance
of motorised vehicles, the rate of bus use Correct your spelling
preference
performance
were
stood at nearly 18 per cent in 1950. Unnecessary verb
apply
Despite
, 1970 saw a Correct pronoun usage
Despite this
remarkably
rise in Change the adverb
remarkable
this
figure and reached just over a quarter, in the following 20 years witnessed a dropping to nearly 17 per cent. In terms of car usage, which was only 5% in the Linking Words
beginnig
, Correct your spelling
beginning
this
figure Linking Words
rocketted
and increased five times in 1970. Correct your spelling
rocketed
Moreover
, Linking Words
this
rising continued Linking Words
in
Change preposition
apply
the
until 1990 and reached Correct article usage
apply
at
almost 40 Remove the preposition
apply
percent
, Change the spelling
per cent
it
means that Correct pronoun usage
which
car
was the most popular transport mode in society in 1990.
Turning to the remaining methods, Correct article usage
the car
proportion
of cycling stood at nearly 27 per cent in the Add an article
the proportion
beginnig
and Correct your spelling
beginning
this
figure Linking Words
constatly
decreased over the period and accounted for just 5 % in 1990. Correct your spelling
constantly
This
was true for the rate of walking which was the most Linking Words
preffered
option in 1950Correct your spelling
preferred
,
and represented Remove the comma
apply
in
almost 40%. The rate of walking Change preposition
apply
pludget
to approximately 8 % in 1990.Correct your spelling
plummeted