
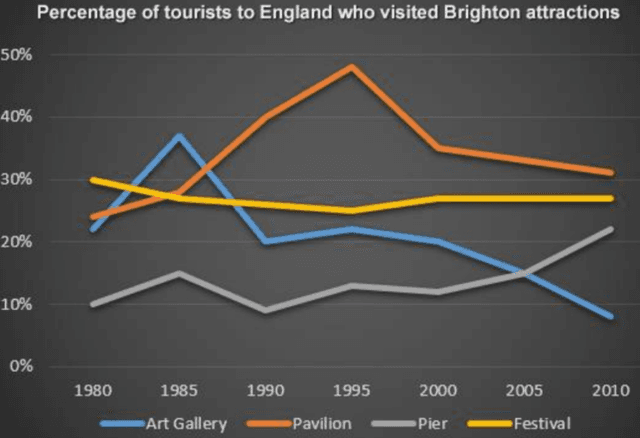
The line graph shows the percentage of tourists who visited Brighton attractions between 1980 and 2010 in England.
Overall
,it is evident from the chart, that there was a downward slope in the proportion of tourists who went to the Festival and Art Gallery.Linking Words
In Contrast
,there was an upward trend in the number of people who visited the Pavilion and Pier over the years.
Linking Words
To begin
with,Art Gallery and Pier stood at 21% and 10% respectively.Linking Words
Then
,it rose slightly to 38% and 15% in 1985 before witnessing Linking Words
flunctuations
between 1990 and 2000.Correct your spelling
fluctuations
Also
,there was an intersection between both at 15% in 2005Linking Words
,
and was at 22% in Pier and 8% in Art gallery which was the least by the end of the period.
Remove the comma
apply
Furthermore
,Festival topped the Linking Words
year
in 1980 at 30% Use synonyms
while
Pavilion was the second highest at 22% in the same Linking Words
year
.In the Use synonyms
Following
Fix capitalization
following
year
,there was a clash in the figure at 28% in 1985.But, Use synonyms
festival
evened out till the Correct article usage
the festival
year
of the Use synonyms
year
and Pavilion witnessed variations before hitting the top of the chart at 30% by 2010.Use synonyms