
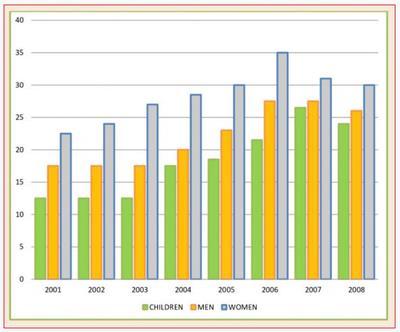
The bar chart, which depicts great detail, provides information about the average number of humans who ate their recommended daily intake of five portions of produce in the UK, between the years 2001 and 2008.
Overall
, it is evidenced that generally, women are those who eat the higher amounts of Linking Words
this
food. Contrarily, children registered the lowest allotments per diem in the course of seven years.
Undoubtedly, females consumed huge quantities of the mentioned edibles. Linking Words
Similarly
, their peak was in the year 2006, in which more than 30% of Linking Words
this
segment of the population in Britain implemented in their diets five pieces of greens. Linking Words
However
, infants do not register numerous quotas, only 25% of their best rate. Linking Words
Therefore
, men collect the intermediate results.
Linking Words
To sum up
, the feminine habitants of the country have a healthier eating regimen, ingesting a far greater proportion of hearty food than the males and youngsters, who do not seem to ingest so many of these eatables. Linking Words
In particular
, their percentile absorption is far less and they include them in their consumption habits to a far lesser extent.Linking Words