
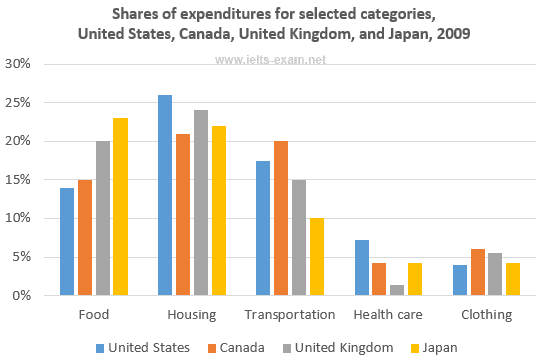
The bar chart below presents the percentage of money allocated for 5 primary categories in 5 different countries in 2009.
Overall
, spending for food, housing and transport accounted for/ made up/ took up the majority, Linking Words
whereas
the figures for health care and clothing were the minority.
Standing at 26%, Americans spent the most on housing which was 4% more than that of Canada. Meanwhile, the highest budget allocated for transportation belonged to Canadians. Linking Words
However
, the money for food in both countries showed little difference. Linking Words
Whereas
the medical expense in the US was the highest, which doubled in Canada, Canadians’s spending on clothing was 3% more than in the US.
Linking Words
Similarly
, housing, food, and transportation took up the majority of the spending of the British and Japanese, at 50% and 55% respectively. Linking Words
Although
there was a similar proportion of expenditure for foodstuff and housing in Japan at 22%, travel expenses were just half. Strikingly, the cost of health services in the UK was the lowest, just one-third compared to clothing, Linking Words
whereas
. those figures in Japan were the sameLinking Words