
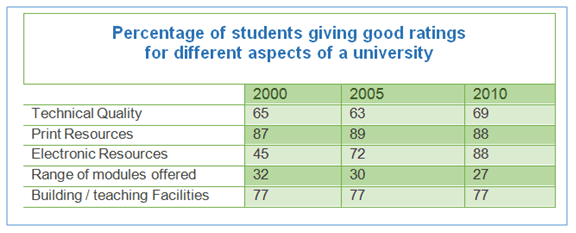
The illustration provides data from surveyed students about a single
universities
in Correct the article-noun agreement
university
inconsecutive
years 2000,2005 and 2010 where 5 aspects were assessed.
Correct article usage
the inconsecutive
Overall
, what stands out isLinking Words
, Building
and Teaching facilities had the same percentage for ten years. Correct your spelling
that building
Moreover
, almost all categories did not witness any considerable alternation Linking Words
besides
, the Electronic Linking Words
resources
.
In the initial year, the Range of modules offered was at the lowest rate at 32% and Electronic Use synonyms
Resources
at 45%. Use synonyms
Furthermore
, Prin Linking Words
Resources
was for 7 more than Building/ Teaching Facilities which was 77 per cent, Use synonyms
while
, Technical Quality was at 65 per cent. Linking Words
In addition
, in the next 5 years, Linking Words
this
group will decrease by only 2%. Linking Words
Also
, for the same proportion Range of modules was reduced. Linking Words
Nevertheless
, Prin Linking Words
Resources
increased by the same amount as the previous one.
In 2010 Print and Electric Use synonyms
Resources
were identical about 88%. Use synonyms
However
, the Range of modules fell by 2% and Technical quality rocketed by 5 digits. Linking Words
While
Linking Words
,
Building Facilities was constant throughout all periods of time at 77%Remove the comma
apply