
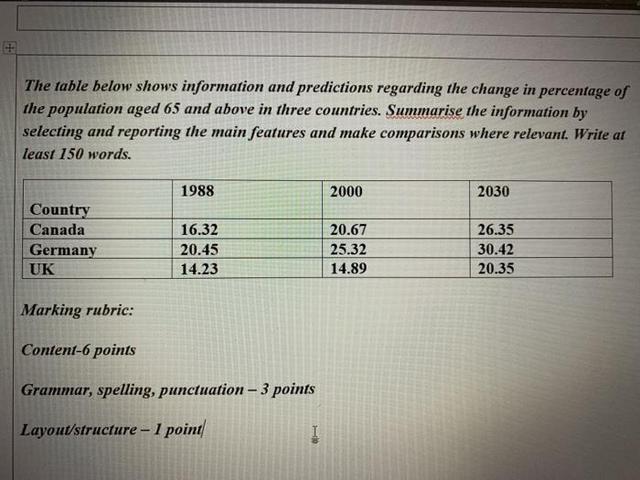
The table illustrates how the proportion of elderly people in Canada, Germany and the UK changed between 1988 and 2000 and gives estimations for 2030.
Overall
, the percentage of the population aged over 65 in all countries increased from 1998 to 2000 and is expected to experience considerable growth in 2030. Linking Words
In addition
, the figures for Germany had consistently the highest ones throughout the period.
20% of German citizens were over 65 years old at the beginning of the stage examined, before rising sharply to 25% in 2000 and being predicted to reach 30% in the final year. A similar change can be seen in the data on Canada, which was 16% in 1988 and 21% in 2000, Linking Words
then
is anticipated to climb to 26% in 2030.
Meanwhile, the share of senior residents in the UK only fluctuated slightly in 1988 and 2002, with respective numbers being 14% and 15%. Linking Words
However
, it is estimated to witness a bigger transformation Linking Words
at the end
of the course to get 20%.Linking Words