
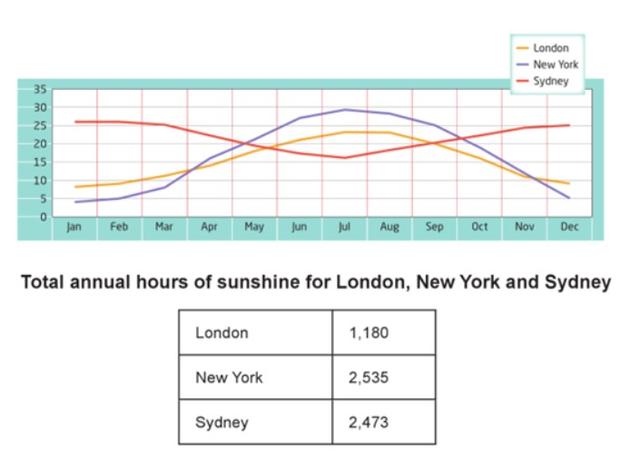
The first line graph shows changes
to
the average monthly temperatures in three major cities. The second data shows the total annual Change preposition
in
hours
of Use synonyms
sunshine
in London, New Use synonyms
York
and Sydney.
Use synonyms
It is clear that
New Linking Words
York
has the highest Use synonyms
temperature
during summer and the lowest during winter. New Use synonyms
York
's Use synonyms
temperature
Use synonyms
influenced
by the annual Add a missing verb
is influenced
hours
of Use synonyms
sunshine
which is the highest among the other.
The first line graph shows changes Use synonyms
to
the average monthly temperatures in three major cities. The second data shows the total annual Change preposition
in
hours
of Use synonyms
sunshine
in London, New Use synonyms
York
and Sydney.
Use synonyms
It is clear that
New Linking Words
York
has the highest Use synonyms
temperature
during summer and the lowest during winter. New Use synonyms
York
's Use synonyms
temperature
Use synonyms
influenced
by the annual Add a missing verb
is influenced
hours
of Use synonyms
sunshine
which is the highest among the other.Use synonyms