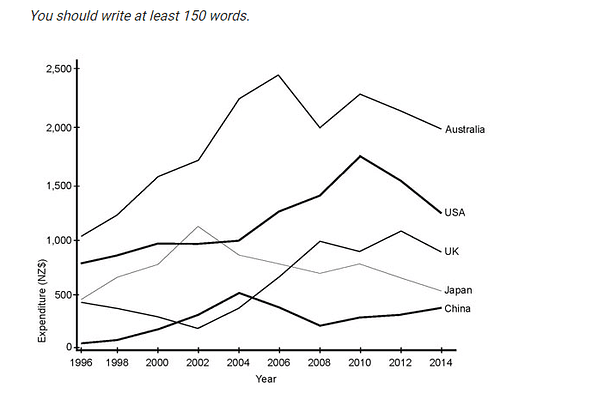
The graph below shows the annual visitor spend for visitors to New Zealand from 5 countries for the years 1996 - 2014

This
illustration figures out about the outcoming to visiting to New Zealand from five countries every year
. This
5 countries are Australia, United State of America, United Kingdom, Japan and China.
Overall
, in every country was fluctation: somewhere rising, somewhere falling. Also
, at starter year
and last
year
was changes.
Going into details, for most visitors of New Zeeland native county was Australia: between more than 1000 and more than two thousand . It may link with location : the nearest country. While
, the rarest people were from China. The statics of China between just more than zero and approximately 5000. The UK located inthe middle of this
statics at last
year
.
Also
, USA has the stability via starting and finishing this
data at second place. The peak for this
country was just more than 1500 in 2010. Comparing with USA, Japan has no that personality: began at 3rd place and end at fourth place. The minimum for Japan was in 1996 - less than 50Submitted by dnm.best on
Unauthorized use and/or duplication of this material without express and written permission from this site’s author and/or owner is strictly prohibited. Excerpts and links may be used, provided that full and clear credit is given to Writing9 with appropriate and specific direction to the original content.
Sentences: Add more complex sentences.
▼
Linking words: Don't use the same linking words: "also, last".
▼
Introduction: The introduction is missing.
▼
Introduction: The chart intro is missing.
▼
Introduction: The chart intro is missing.
▼
Vocabulary: Replace the words year with synonyms.
▼
Vocabulary: Rephrase the word "undefined" in your introduction.
▼