
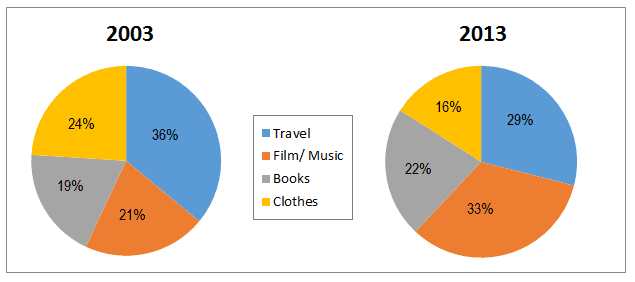
The pie graphs illustrate the internet purchasing sales for four retail sections namely travel, films / music, books and clothes in
ten
Correct determiner usage
a
years
period, between 2003 and 2013 in New Zealand.
In general, travel was the biggest portion of the graph in 2003 Correct your spelling
ten-year
while
Linking Words
this
had a decrease in 2013 and so, film/ music became the highest section. Linking Words
Also
, the clothes were the least proportion.
Linking Words
According to
the pie chart, Linking Words
firstly
, travel with 36 per cent was the dominant position in the first period but Linking Words
this
matter is not true in the second period. Linking Words
Secondly
, the film segment with a 12% increase during the 10 years became the largest buying which was 33%.
Linking Words
On the other hand
, Linking Words
initially
, the books retail was the lowest part in the first year(19%) Linking Words
whereas
Linking Words
this
rose in the Linking Words
last
year(22%). Linking Words
Finally
, in terms of the clothes sector, Linking Words
this
plummeted from just under a quarter to a minority (16%).Linking Words